In modern retail banking, customer data is a vital strategic asset, yet it routinely remains trapped within isolated silos like Core Banking, CRM, mobile apps, and contact centers. This fragmentation blinds institutions to the true consumer journey, leading to disconnected customer experiences and wasted cross-selling efforts. Implementing a dedicated Customer 360 dashboard bank solution is the definitive step to consolidate these disparate pipelines into a single source of truth, empowering teams to execute rapid, data-driven retention and growth strategies.
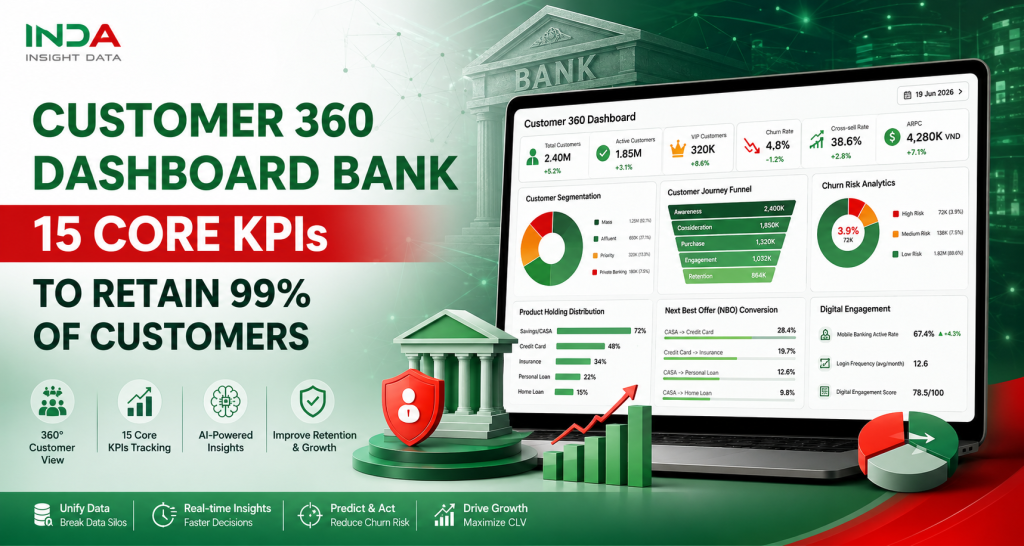
Table of Contents
The Strategic Position of a Customer 360 Dashboard in Retail Banking
From an architectural standpoint, a Customer 360 dashboard bank solution functions as an enterprise-grade analytical control center. It consolidates, reconciles, and visualizes the complete end-to-end consumer journey across all digital and physical touchpoints.
This advanced solution goes far beyond maintaining basic demographic fields or static Know Your Customer (KYC) data. Instead, it serves as a dynamic repository that continuously ingests, cleanses, and interprets real-time transactional velocity, digital channel engagement patterns, total asset liabilities, predictive churn risk thresholds, and automated cross-selling options generated by artificial intelligence.
By leveraging automated entity resolution workflows, the system successfully binds disparate footprints to a unique Customer Information File (CIF) code. This process completely eliminates duplicate customer profiles and ensures absolute data accuracy across departments.
When executing an enterprise-wide customer data platform initiative, retail banking leaders are driven by three primary strategic imperatives:
- Absolute synthesis of customer profiles: Ensuring that unstructured behavioral data and structured account fields are mapped seamlessly to a single identifier.
- Omnichannel journey visibility: Allowing the bank to trace a consumer’s relationship lifecycle from the initial digital onboarding stage via electronic KYC (eKYC) protocols all the way to their migration into premium wealth management accounts.
- Real-time decision support: Empowering executive leadership teams and operational managers to detect shifting market trends, evaluate campaign efficiencies, and deploy resources dynamically.
To maximize usability and accelerate the decision-making loop, a standard interface layout for a banking customer dashboard is structured into five core, high-impact functional areas.
The uppermost section features a series of summary performance cards that present macro-level institutional health metrics, including active base expansion and baseline attrition rates. Immediately following is the customer segmentation matrix, which visually maps the volume and proportional weight of Mass, Affluent, Priority, and Private Banking cohorts.
The remaining visual real estate is explicitly dedicated to performance optimization engines. This includes product holding distribution curves, a predictive churn analytics panel, and a localized next best offer recommendation matrix designed to optimize cross-selling conversions.
Deconstructing the 15 Core KPIs on a Banking Customer 360 Dashboard
Customer Overview Metrics
The first foundational pillar of a retail banking dashboard focuses on measuring the absolute scale, health, and acquisition velocity of the underlying customer database.
Total Customers: This metric counts the absolute volume of unique, legally compliant, and active CIF codes housed within the master data warehouse. It serves as the primary baseline for computing overall banking market share and evaluating long-term market expansion strategies.
Active Customers: To assess the true commercial vitality of this base, executives monitor users who have initiated at least one revenue-generating or active transaction within the preceding ninety-day window. A widening divergence between the total customer volume and the active customer base indicates a large pool of dormant accounts, which represents a heavy drain on infrastructure maintenance costs.
New Customers: This metric captures the volume of recently onboarded profiles within a specific reporting interval. It serves as a direct reflection of market penetration capabilities and the operational efficiency of automated digital acquisition funnels.
Customer Value Metrics
Understanding the exact financial contribution of individual segments allows banks to allocate their marketing budgets, operational assets, and relationship management resources with high precision.
Customer Lifetime Value (CLV): This KPI applies forward-looking predictive models to calculate the total net profit an individual is projected to generate throughout their entire relationship lifecycle. By analyzing historical behavior and margin contributions, this metric allows data scientists to identify high-potential retail users and proactively transition them into high-touch Priority or VIP Banking tiers.
Average Revenue Per Customer (ARPC): This index is computed by dividing the sum of net interest income and non-interest fee income by the total active user base, offering an immediate assessment of the bank’s monetization efficiency per capita.
Product Holding Rate: To consistently scale revenue, retail product managers heavily rely on tracking the average number of active financial products held simultaneously by a single consumer. When a customer deeply embeds themselves into the bank’s ecosystem – by maintaining a primary checking account, utilizing a personal credit card, and purchasing a bancassurance policy – relationship stickiness scales exponentially. Consequently, modern retail banking institutions establish a firm strategic mandate to drive this specific index well past a critical threshold of 3.0 products per customer.
Digital Engagement Metrics
In an era defined by digital-first distribution strategies, tracking user interaction levels within digital environments is essential for institutional survival.
Mobile Banking Active Rate: This metric calculates the exact percentage of the customer base that logs into and transacting through the native mobile app at least once within a rolling thirty-day period. It serves as a definitive benchmark for evaluating user adoption of digital channels and measuring the ROI of software development initiatives.
Login Frequency: To acquire deeper insights into daily digital behavior, analytics engines track the average number of times a user opens and interacts with the application over a week or month. This indicates whether the digital platform has integrated successfully into the consumer’s daily routines.
Digital Engagement Score: To form a complete view of digital behavior, individual actions across mobile apps, internet portals, website visits, email response click-throughs, and automated chatbot interactions are synthesized into a single quantitative index. This score allows data analysts to segment the customer base based on digital participation and accurately flag accounts showing signs of digital disengagement.
Customer Retention Metrics
Defending the existing customer base against aggressive acquisition campaigns by fintech competitors is significantly more capital-efficient than funding new customer acquisition funnels.
Churn Rate: This acts as an essential risk indicator on any banking dashboard, calculating the precise percentage of users who fully close their accounts, completely withdraw their revolving capital, or cease all transaction operations within a given reporting period.
Retention Rate: Operating as the direct mathematical inverse of churn, this index measures institutional stability. It reflects the bank’s capacity to maintain long-term consumer relationships through superior service delivery and competitive product pricing.
Churn Risk Score: To transition from passive historical reporting to proactive attrition mitigation, mature banking platforms integrate a predictive score powered by automated machine learning models. By continuously scanning for subtle behavioral anomalies – such as a steady decay in average CASA balances or a drop-off in application login frequency – the analytical engine automatically categorizes vulnerable users into High, Medium, and Low risk tiers. This allows customer retention teams to deploy personalized incentives before account abandonment occurs.
Cross-sell Metrics
The systematic execution of cross-selling strategies remains the primary mechanism for maximizing profitability per capita and driving capital efficiency in retail banking.
Cross-sell Rate: This index records the percentage of the customer base that successfully acquires a secondary, tertiary, or additional product beyond their primary core account. It offers clear visibility into the collaboration efficiency between product factories and distributed sales channels.
Product Penetration Rate: To evaluate the market footprint of specific high-margin lines, product managers monitor the proportional distribution of core offerings, such as credit cards, wealth management portfolios, or mortgages, across the entire customer base.
Next Best Offer (NBO) Conversion Rate: This final metric calculates the exact percentage of automated, AI-driven product recommendations presented across digital channels that are successfully accepted and converted into active accounts by consumers, providing a clear metric for optimizing recommendation algorithms.
Centralized Data Architecture and Lineage Matrix
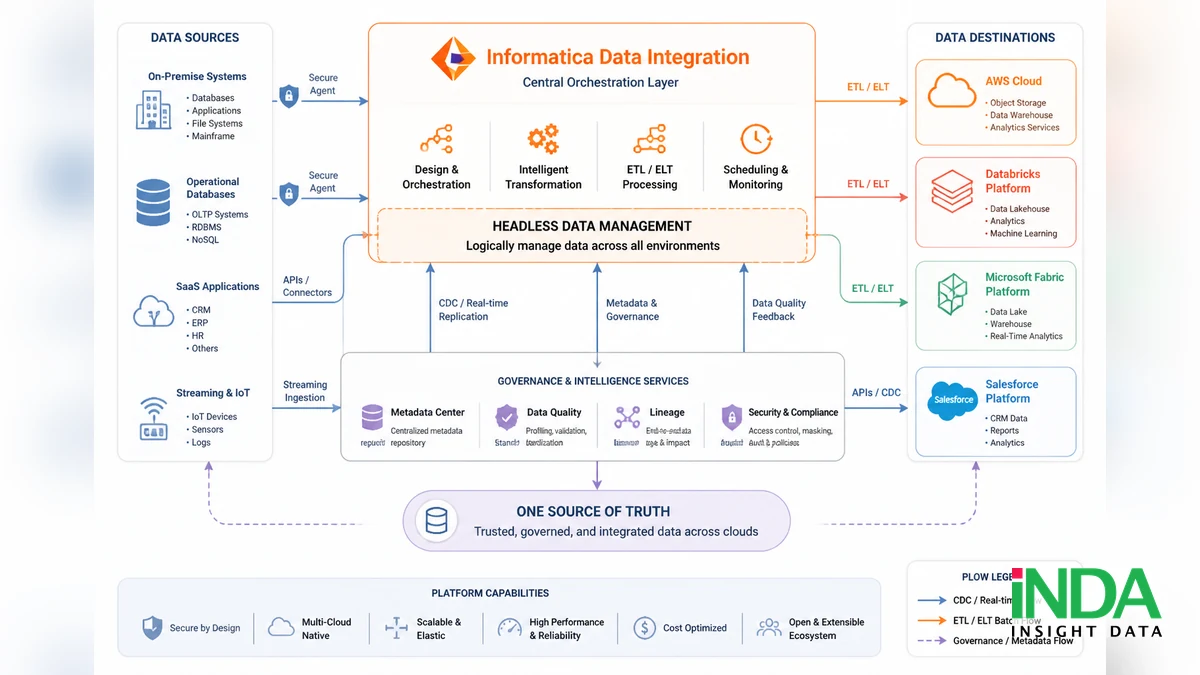
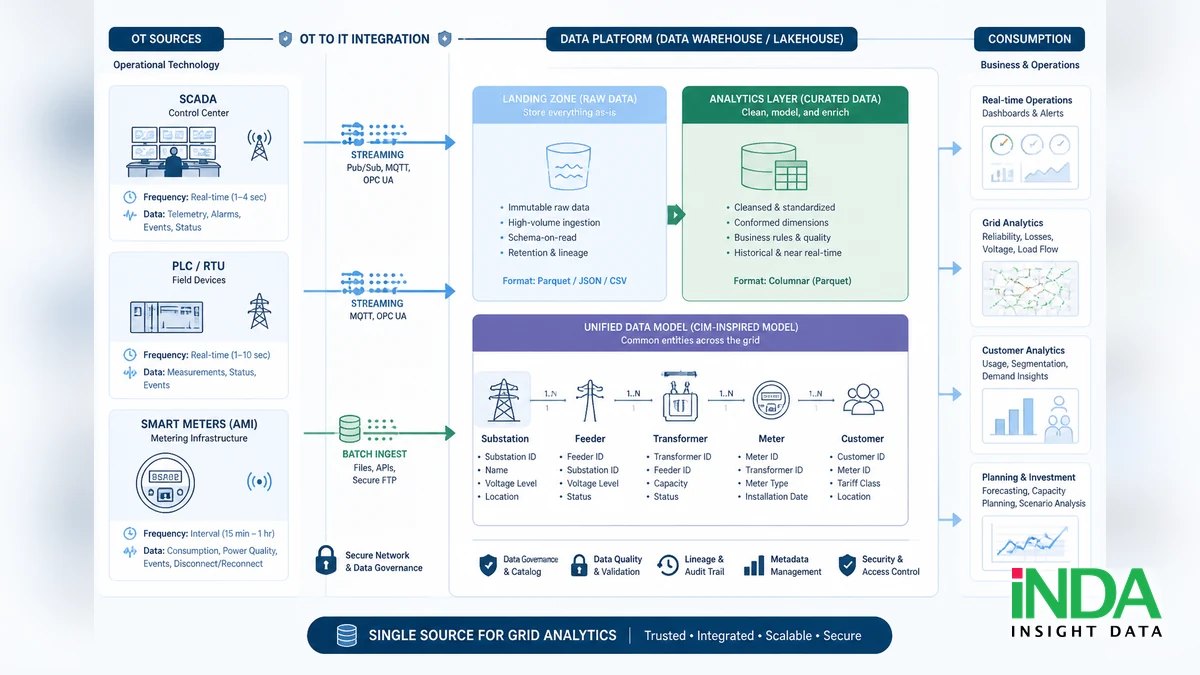
To ensure that the 15 core KPIs operate with minimum latency and absolute data integrity, a customer 360 dashboard bank implementation must be anchored to a centralized data infrastructure. This requires building robust data pipelines that ingest, transform, and load information from unstructured and structured transactional environments into an integrated Enterprise Data Warehouse or high-performance Data Lake.
The standard extraction architecture maps core operational domains into predefined integration streams. Demographics and KYC fields are sourced from Core Banking and Enterprise CRM systems to capture names, age, location, and verified income tiers. Financial balance streams pull daily balances from core ledgers and card platforms to compute CASA health and outstanding credits.
Digital behavioral logs extract micro-level clickstreams and application login timestamps from internet banking systems. Interaction histories aggregate complaints and resolution times from contact centers or chatbots, while the predictive analytics stream pulls calculations directly from the AI/ML modeling engine to populate risk scores and customer lifecycle projections. By establishing this automated architecture, retail banks completely eliminate manual reporting errors and ensure that all units base their tactical plans on an identical data pool.
Real-World Case Study: Performance Insights From a Live Executive Dashboard
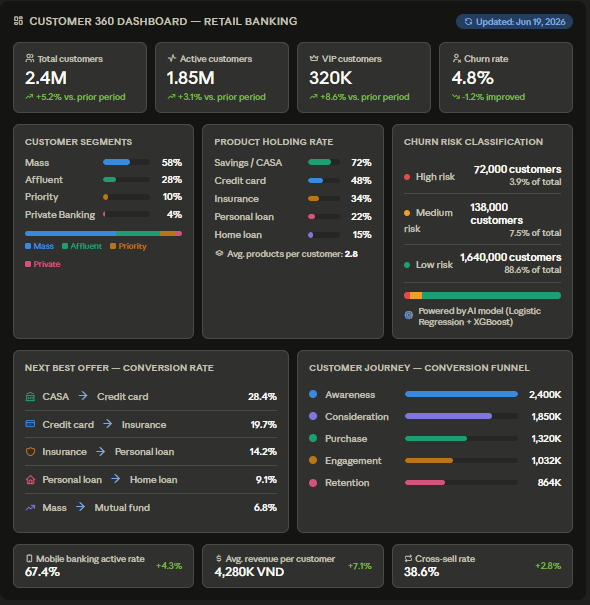
To demonstrate how a retail banking executive leverages this Customer 360 dashboard bank tool, let us analyze an active operational report extracted directly from a live production environment updated on June 19, 2026, as displayed in the production dashboard. Synthesizing these metrics reveals deep, actionable business narratives rather than isolated numerical points.
High-Level Performance and Latent Risk Exposures
According to the top-tier KPI summary cards, the bank’s total base has reached 2.4M customers, representing a steady growth of +5.2% against the prior period. Active users stand strong at 1.85M (+3.1%), indicating a healthy overall ecosystem activity rate of approximately 77%.
Crucially, the premium VIP segment registered the most accelerated expansion, growing at +8.6% to touch 320K customers. On the defensive front, the baseline Churn Rate is well-managed at 4.8%, reflecting a 1.2% improvement compared to the previous cycle.
However, cross-referencing these numbers with advanced Churn Risk Analytics – powered by institutional AI models utilizing Logistic Regression and XGBoost – uncovers structural pressures. The system highlights exactly 72,000 customers classified within the High-Risk category (accounting for 3.9% of the base) alongside 138,000 customers sitting at Medium-Risk (7.5%).
This requires immediate executive intervention: the operations team must instantly extract these 72,000 specific CIF profiles to deploy hyper-targeted retention offers before account closure occurs.
Conversion Funnel Optimization & “Bottleneck” Discovery
The Customer Journey Conversion Funnel visualization on the dashboard exposes precise transactional friction points across the digital experience lifecycle:
- Awareness Stage: 2,400K unique customer profiles.
- Consideration Stage: 1,850K active logging users.
- Purchase Stage: 1,320K unique product opening conversions.
- Engagement Stage: 1,032K deeply active interacting users.
- Retention Stage: 864K long-term loyal customer accounts.
The data reveals that the most severe customer drop-off happens between the Consideration (1,850K) and Purchase (1,320K) stages. While marketing and initial onboarding channels successfully drive user attention and system logins, a major drop occurs when consumers attempt to finalize a new product opening or execute a major financial commitment.
This represents a strategic bottleneck. Digital Product and UI/UX engineering teams must immediately simplify registration workflows. Conversely, the final tail end from Engagement to Retention retains a massive 83.7% of users, proving that once a consumer interacts deeply, brand loyalty is exceptionally strong.
AI-Driven Cross-Selling and Revenue Generation Engines
Currently, the bank’s Average Product Holding Rate sits at 2.8 products per customer. Mechanically looking at the product mix, Savings/CASA remains the foundational pillar with a dominant 72% penetration rate, followed by Credit Cards at 48% and Insurance at 34%.
Long-term lending products, namely Personal Loans (22%) and Home Loans (15%), maintain significant untapped headroom. To advance the overall product holding rate beyond the strategic target of 3.0, the Next Best Offer data analytics module highlights clear optimization paths based on historical conversion probabilities.
The core pipeline converting existing CASA users to Credit Cards yields the highest efficiency with an impressive 28.4% conversion rate. This campaign should be immediately automated and deployed at scale via the Mobile Banking application, which boasts a high active usage rate of 67.4% (+4.3%).
Additionally, cross-selling insurance packages directly to current credit cardholders demonstrates a solid 19.7% conversion probability. Driven by these personalized data-led workflows, the aggregate bank-wide Cross-sell Rate expanded steadily by +2.8% to hit 38.6%.
This has directly catalyzed financial growth, driving the Average Revenue Per Customer to 4,280K VND, a strong 7.1% increase over the prior period.
Why Banking Customer 360 Dashboard Initiatives Fail
Despite allocating significant capital expenditures toward acquiring modern data visualization frameworks, many commercial banking institutions fail to generate measurable business impact from their customer dashboard platforms. This failure is often rooted in three critical operational and architectural mistakes.
The first and most prevalent issue is prioritizing aesthetic front-end design while completely neglecting the foundational data layer. When an institution deploys visual indicators without addressing downstream data cleansing, master data management, and entity resolution, data reliability breaks down. For example, a single customer can appear as two entirely distinct profiles within the core reporting engine due to a minor variation in their phone number formatting. These errors rapidly erode staff trust in the dashboard’s data integrity.
The second structural flaw is the complete omission of unstructured behavioral telemetry from the analytical stream. Many organizations limit their dashboard inputs to traditional batch data, such as end-of-day ledger balances, leaving the platform blind to real-time mobile clickstreams, application drop-offs, and contact center complaint sentiment. Without integrating these behavioral signals, the system cannot detect friction points until after the consumer has already transitioned their capital to a competitor.
The third major mistake is designing the platform to operate exclusively as a historical record rather than a forward-looking predictive tool. A platform that only tracks realized transactions functions like a rearview mirror, showing what has already occurred without providing prescriptive intelligence for the future.
To drive true business value, a customer dashboard must actively incorporate machine learning frameworks that translate raw historical trends into real-time recommendations, allowing frontline staff to confidently deploy the optimal retention or acquisition strategy.
Insight Data (INDA) – Your Trusted Customer 360 Implementation Partner
Insight Data helps organizations successfully implement Customer 360 initiatives by providing end-to-end services, from architecture consulting and system integration to data consolidation, user training, knowledge transfer, and operational optimization. Backed by a team of experts with more than 10 years of experience in data, analytics, and AI, INDA has partnered with banks, financial institutions, and large enterprises to modernize data infrastructures and accelerate digital transformation journeys.
At Insight Data, technology is only part of the equation. We focus on addressing real business challenges and delivering solutions that align with each organization’s existing systems, operational workflows, and long-term strategic goals. This practical approach enables businesses to reduce implementation time, optimize investment costs, and maximize the value of their data assets.
Whether your organization is looking to build a unified customer view, enhance customer engagement, or strengthen data-driven decision-making, Insight Data can help you develop a Customer 360 strategy tailored to your unique business requirements.
Get in touch with our experts to explore how a Customer 360 solution can support your organization’s growth and transformation objectives.
Frequently Asked Questions (FAQ)
Q1: Is an enterprise Customer 360 Dashboard structurally identical to an upgraded CRM system?
No, these two solutions occupy entirely distinct layers within a modern banking enterprise architecture. A CRM platform functions primarily as an operational database utilized by front-line sales teams and service agents to record interaction notes, schedule appointments, and manage pipeline opportunities.
Conversely, a Customer 360 dashboard bank framework operates as an analytical aggregation engine. It ingests large volumes of data from CRMs, core banking systems, external card engines, and digital applications to reconcile profiles and generate high-level visualization tools for executive strategy formulation.
Q2: Is the integration of Artificial Intelligence mandatory during the initial deployment phase?
No, embedding advanced machine learning algorithms is not a strict requirement for the launch phase. During Phase 1, an institution can build a highly effective dashboard by applying deterministic, rule-based business logic to segment users and track performance.
However, as the platform matures and begins tracking complex metrics like dynamic churn risk scores or automated product affinity recommendations, integrating machine learning models like Logistic Regression and XGBoost becomes necessary to achieve optimal statistical accuracy.
Q3: Should the data processing pipelines on the dashboard refresh in real-time or via daily batches?
The optimal data refresh frequency depends entirely on the specific requirements of each data domain. Structural data fields, such as core demographic updates, monthly income reassessments, and strategic segment classifications, only require daily batch updates.
On the other hand, operational fields like digital login drop-offs, transaction failures, and fraud alerts must be processed via real-time or near-real-time streaming pipelines, enabling operational retention teams to intervene before a negative user experience leads to churn.
Conclusion and Strategic Action Plan
For financial institutions aiming to thrive as data-driven organizations, building a comprehensive Customer 360 dashboard bank solution has transitioned from an optional IT initiative to an essential operational capability. By systematically dismantling long-standing data silos across departments, this framework provides a clear, consistent view of the entire consumer journey.
To ensure project success, banking executives must focus on establishing a solid data infrastructure and correctly tracking the 15 core Key Performance Indicators outlined in this guide. Transforming fragmented data into precise, localized operational actions remains the ultimate key to maximizing customer lifetime value in the digital banking era.
About INDA (Insight Data)
Insight Data Analytics Solutions Co., Ltd. (INDA) is a consulting and implementation partner specializing in Data, Business Intelligence (BI), and Artificial Intelligence (AI) solutions for organizations across banking, financial services, insurance, securities, and other industries.
We help organizations build modern data foundations, unlock the full value of their data assets, and leverage AI technologies to improve operational efficiency, accelerate innovation, and drive sustainable business growth.
INDA’s Core Services
- Data & AI Strategy Consulting
- Enterprise Data Platform Development
- AI, Generative AI, and AI Agent Implementation
- Data & IT Talent Outsourcing Services
- Industry- and Department-Specific Business Intelligence Solutions
- Custom Software and Solution Development
At INDA, we combine deep domain expertise with practical implementation experience to deliver solutions that align with each organization’s unique business objectives, technology landscape, and long-term transformation roadmap.
Contact INDA today to explore the right data, BI, and AI solutions for your business.